Interactive Overview
Slider Interactive: A series of labeled graphics with captions. Below the caption is a horizontal slider bar with six labeled stops and a solid white circle. Dragging the white circle right and left along the slider bar causes the graphics, labels, and caption to change. The change occurs gradually as one set of graphics, along with its associated caption and labels, fades out and the next fades in. A toggle button to the upper right of the image turns the image labels off and on. The labels are in the form of text with arrows pointing to specific features on the graphics.
Slider Stops
From left to right, the slider stops are labeled: 0 hours, 0.75 hours, 2.5 hours, 4.25 hours, 5 hours, and 3 orbits.
Summary of Slider Stops
Sliding left to right reveals the following:
- “0 hours” shows a telescope pointing toward an exoplanet and its full circular orbital path around a star; a view of the orbit passing between the star and viewer; and a graph of apparent brightness versus time. This is the initial image shown when the interactive is loaded.
- “0.75 hours” shows the same layout, with changes in the position of the planet and diagrams and graph to reflect the exoplanet beginning to transit in front of its star.
- “2.5 hours” shows the same layout, with changes in the diagrams and graph to reflect the exoplanet’s position in the middle of the transit.
- “4.25 hours” shows the same layout, with changes in the diagrams and graph to reflect the exoplanet’s almost-complete transit.
- “5 hours” shows the same layout, with changes in the diagrams and graph to reflect the exoplanet’s complete transit.
- “3 orbits” shows a graph of apparent brightness versus time with three major valleys, indicating three transits by the exoplanet.
Stop 1: 0 hours
Image Description: 0 hours
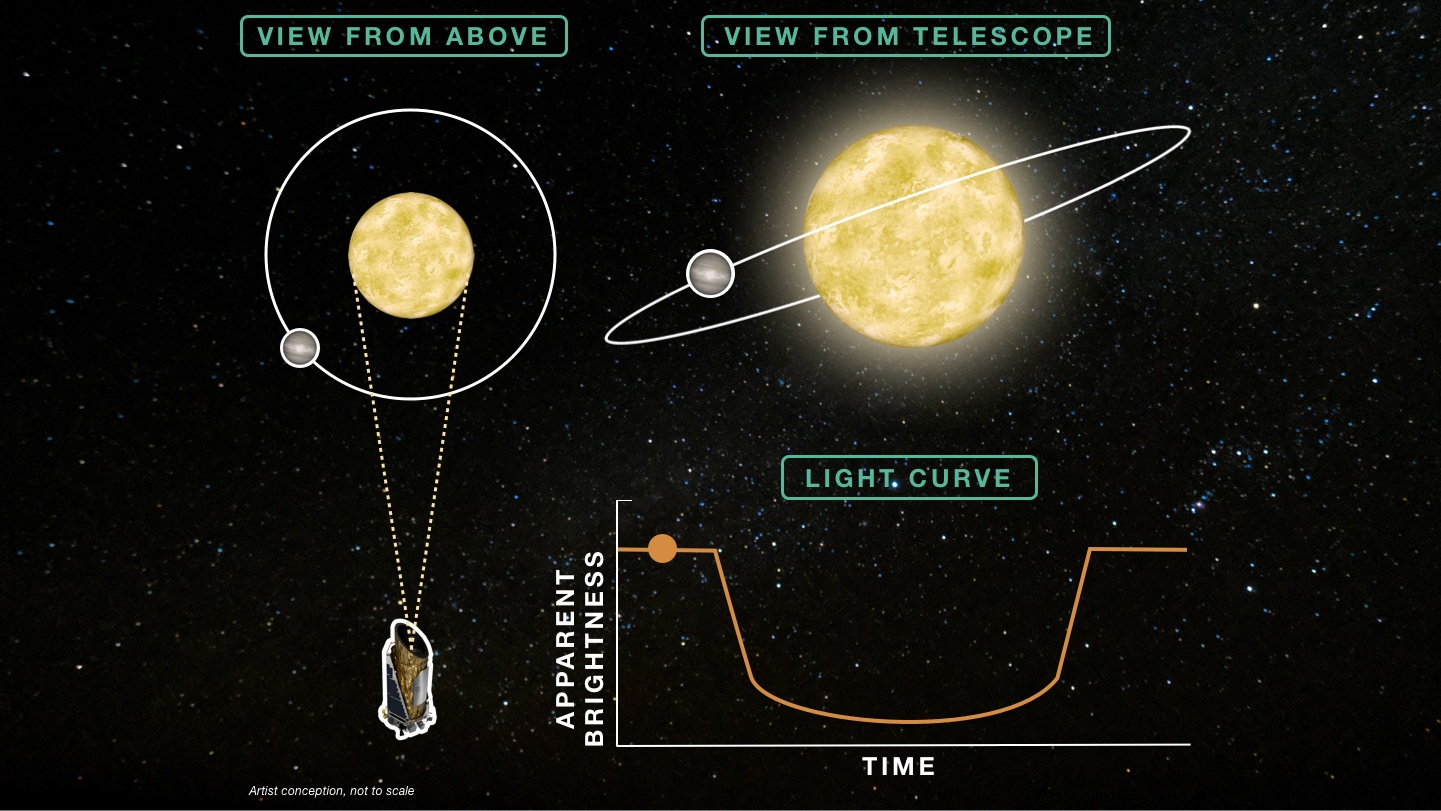
A set of three diagrams against a star-filled background: “View from Above” (left), “View from Telescope” (top right), and “Light Curve” (bottom right). At the bottom left is italicized text that reads “Artist conception, not to scale.”
“View from Above” shows a star as a mottled yellow circle with a white ring around it to represent a planet’s orbit; a gray circle smaller than the star to represent a planet; and a telescope below that points toward the star and full orbit of the planet. The star, planet, planet’s orbit, and telescope are all in the same plane, so that the telescope is looking through the orbit ring to see the star. The planet is positioned along the orbit at the 8 o’clock position relative to the star. The lines of sight between the telescope and the edges of the star are shown as two dashed yellow lines. At this stop, the planet is to the left of the left line of sight.
“View from Telescope” shows the star surrounded by a flattened ellipse-shaped ring representing the planet’s orbit as seen from the side. The orbit passes behind the star and is not fully visible from this angle. The planet is located toward the left of the star.
“Light Curve” shows a line graph of “Apparent brightness” on the y-axis versus “Time” on the x-axis, with a solid orange circle plotted to show the apparent brightness of the star-planet system at the time illustrated in the two other diagrams. The graphed line begins high and flat, and then dips to form a broad letter U before increasing and becoming leveled once more. The orange circle is plotted on the flat area to the left of the U-shaped valley.
Labels: 0 hours
There are four text labels. In “View from Above,” the yellow circle is labeled “Star.” The small gray circle toward the star’s bottom left is labeled “Planet.” The graphic below is labeled “Telescope.” In “Light Curve,” the solid orange circle plotted on the graph is labeled “Star is at maximum apparent brightness.”
Caption: 0 hours
Before the transit begins, none of the starlight is blocked.
Stop 2: 0.75 hours
Image Description: 0.75 hours
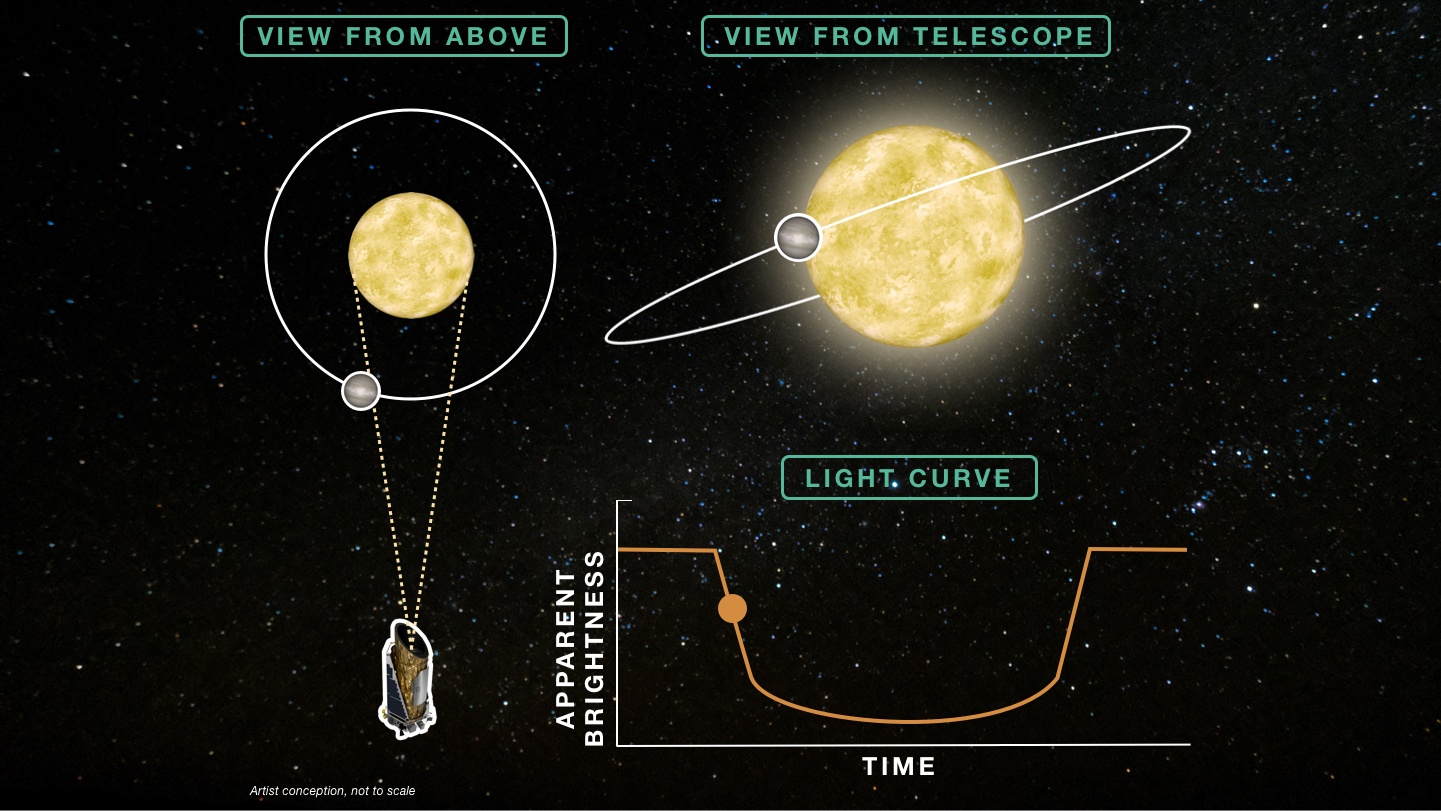
This stop has the same layout as in the prior stop, with three diagrams: “View from Above,” “View from Telescope,” and “Light Curve,” and italicized text at the bottom left that reads “Artist conception, not to scale.”
In “View from Above,” the planet is positioned along the orbit at the 7 o’clock position relative to the star, intersecting the left line of sight.
In “View from Telescope,” the planet is positioned along the orbit, with part of the planet covering the left edge part of the star.
“Light Curve” shows the orange circle now plotted near the top of the left wall of the U-shaped valley.
Labels: 0.75 hours
There is one text label. In “Light Curve,” the solid orange circle plotted on the graph is labeled “Star appears to dim.”
Caption: 0.75 hours
As the transit begins, the brightness of the star decreases slightly.
Stop 3: 2.5 hours
Image Description: 2.5 hours
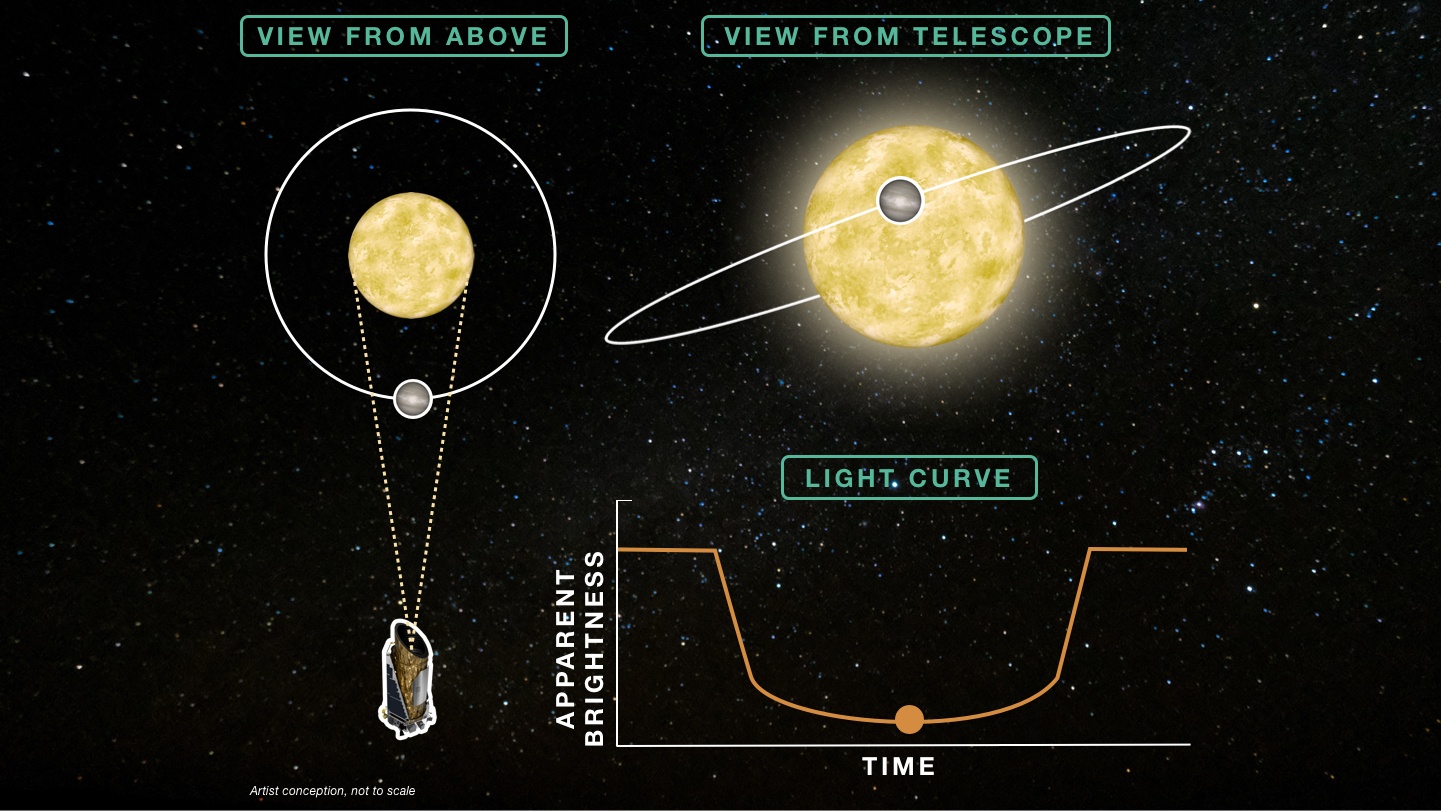
This stop has the same layout as in the prior stops, with three diagrams: “View from Above,” “View from Telescope,” and “Light Curve,” and italicized text at the bottom left that reads “Artist conception, not to scale.”
In “View from Above,” the planet is positioned along the orbit at the 6 o’clock position relative to the star, between the right and left lines of sight.
In “View from Telescope,” the planet is positioned along the orbit, fully in front of the star and blocking a small part of it.
“Light Curve” shows the orange circle now plotted in the middle along the floor of the U-shaped valley.
Labels: 2.5 hours
There is one text label. In “Light Curve,” the solid orange circle plotted on the graph is labeled “Minimum starlight reaches telescope.”
Caption: 2.5 hours
The brightness of the star appears lowest in the middle of the transit, when the planet is between the star and the telescope.
Stop 4: 4.25 hours
Image Description: 4.25 hours
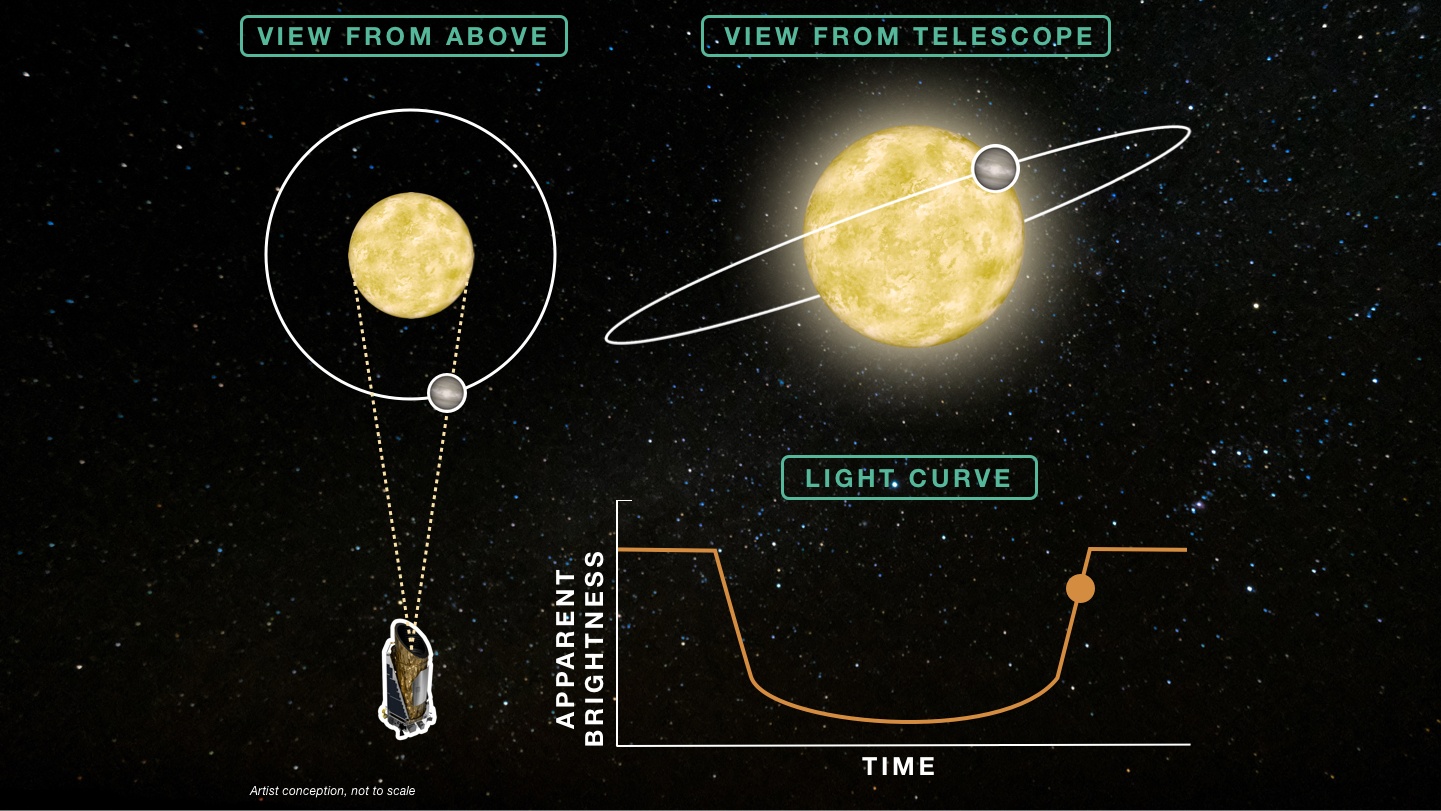
This stop has the same layout as in the prior stops, with three diagrams: “View from Above,” “View from Telescope,” “Light Curve,” and italicized text at the bottom left that reads “Artist conception, not to scale.”
In “View from Above,” the planet is positioned along the orbit at the 5 o’clock position relative to the star, intersecting the right line of sight.
In “View from Telescope,” the planet is positioned along the orbit, with part of the planet covering the right edge of the star.
“Light Curve” shows the orange circle now plotted near the top of the right wall of the U-shaped valley.
Labels: 4.25 hours
There is one text label. In “Light Curve,” the solid orange circle plotted on the graph is labeled “Star appears to brighten.”
Caption: 4.25 hours
As the planet completes its transit, the brightness of the star appears to increase.
Stop 5: 5 hours
Image Description: 5 hours
This stop has the same layout as in the prior stops, with three diagrams: “View from Above,” “View from Telescope,” and “Light Curve,” and italicized text at the bottom left that reads “Artist conception, not to scale.”
In “View from Above,” the planet is positioned along the orbit at the 4 o’clock position relative to the star, to the right of the right line of sight.
In “View from Telescope,” the planet is positioned along the orbit, to the right of the star.
“Light Curve” shows the orange circle now plotted on the flat area to the right of the U-shaped valley.
Labels: 5 hours
There is one text label. In “Light Curve,” the solid orange circle plotted on the graph is labeled “Star is at maximum apparent brightness.”
Caption: 5 hours
When the transit is complete, the star is back to its normal apparent brightness.
Stop 6: 3 orbits
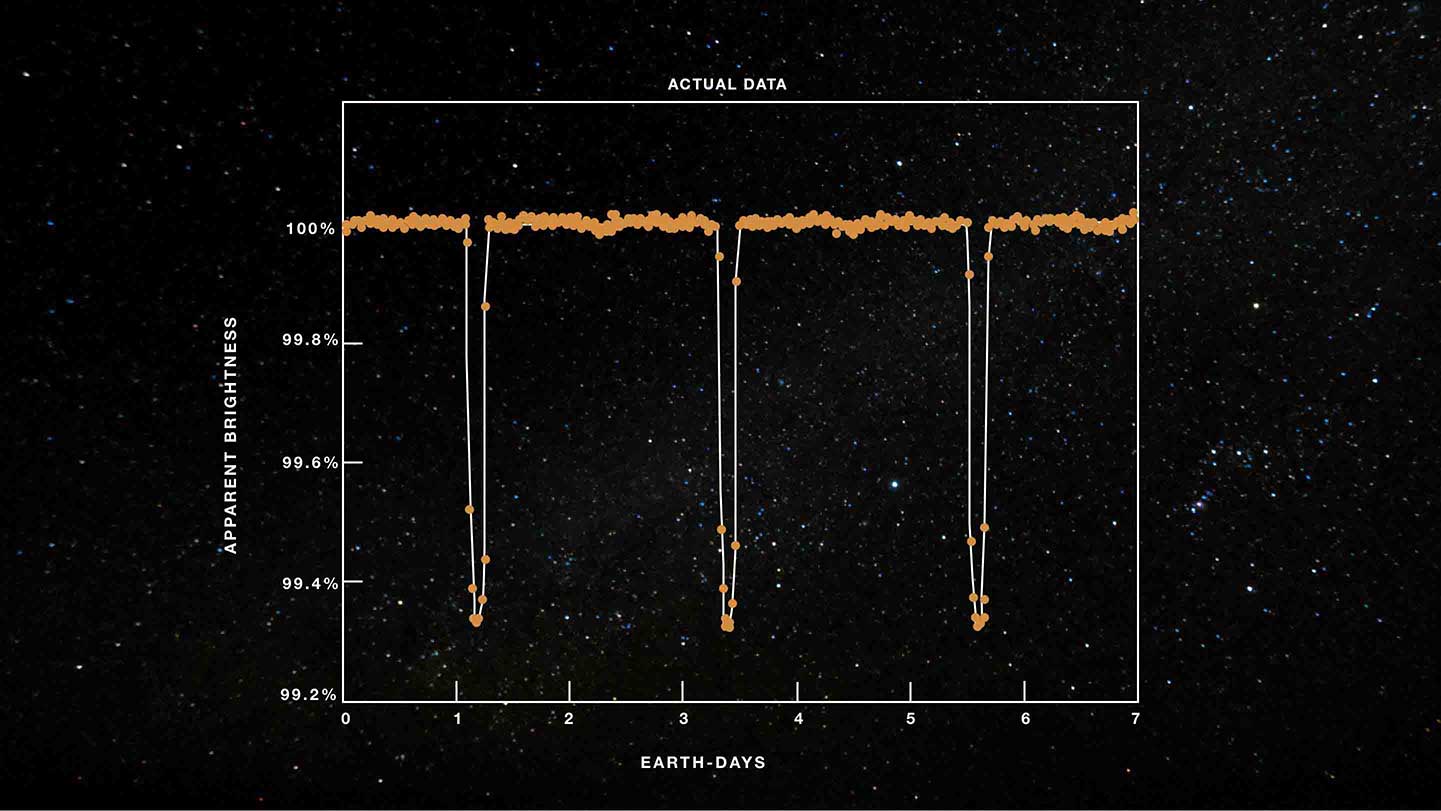
Image Description: 3 orbits
A graph of “Apparent brightness” on the y-axis versus “Earth-days” on the x-axis. The graph is labeled “Actual Data.” The y-axis ranges from 99.2 percent at the origin on the bottom to 100.2 percent at the top, in even increments of 0.2 percent. The x-axis ranges from 0 days at the far left to 7 days at the far right, labeled in even increments of one Earth-day. The data are plotted as orange solid circles, connected by a thin white line. The data form a straight flat line with a y-value of about 100 percent, cut by a series of three deep, narrow valleys. All three valleys reach down to a value of about 99.3 percent. The valleys are evenly spaced over time, occurring at about 1.2, 3.4, and 5.6 Earth-days.
Labels: 3 orbits
There are three text labels. The first valley is labeled “First Transit.” The next is labeled “Second Transit,” and the final valley is labeled “Third Transit.”
Caption: 3 orbits
A regular pattern of brightness dips is evidence that a planet is orbiting the star.