Interactive Overview
Slider Interactive: A series of images showing the starburst galaxy M82 in different wavelengths of light, along with the associated spectrum of light. Below the caption is a horizontal slider bar with five labeled stops and a solid white circle. Dragging the white circle right and left along the slider bar causes the image, labels, and caption to change. The change occurs gradually as one image, along with its associated captions and labels, fades out and the next fades in. A toggle button to the upper right of the image turns the image labels off and on. Labels are in the form of text with arrows pointing to specific features in the image. Other labels are graphic overlays.
Slider Stops
From left to right, the slider stops are labeled: Multi-wavelength, X-ray, Visible, Mid-infrared, and Far-infrared.
Summary of Slider Stops
Sliding left to right reveals the following:
- “Multi-wavelength” stop shows galaxy M82’s spectrum of light on the left and a composite image of all the interactive’s wavelengths combined on the right. A spectrum bar is below. This is the initial image shown when the interactive is loaded.
- “X-ray” stop shows the same layout with the spectrum of X-ray light on the left, and an image on the right depicting the galaxy as blue wisps of smoke-like material. A spectrum bar is below.
- “Visible” stop shows the same layout with the spectrum of visible light on the left, and an image on the right depicting the galaxy as brown threads of material among a blue-white cloudy glow. A spectrum bar is below.
- “Mid-infrared” stop shows the same layout with the spectrum of mid-infrared light on the left, and an image on the right depicting the galaxy as fluffy, red material among a blue-white cloudy glow. A spectrum bar is below.
- “Far-infrared” stop shows the same layout with the spectrum of far-infrared light on the left, and an image on the right depicting the galaxy as glowing yellow and orange hazy material. A spectrum bar is below.
Stop 1: Multi-wavelength
Image Description: Multi-wavelength
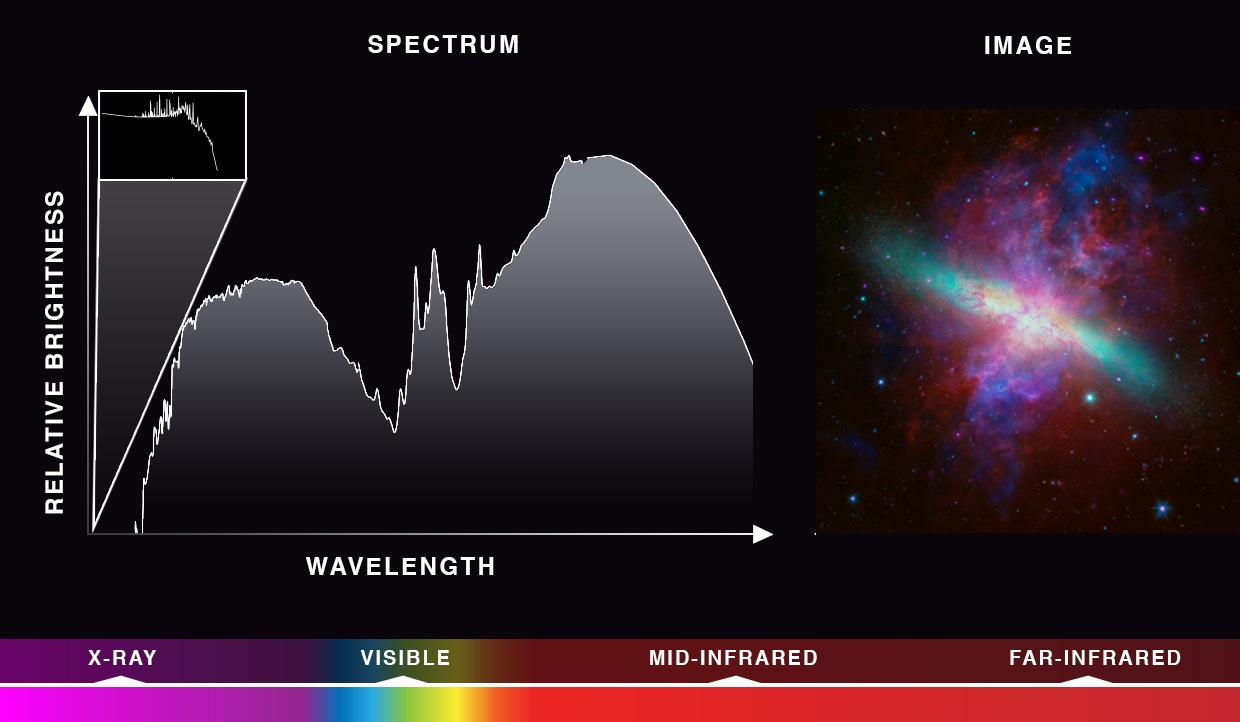
Against a black background, there are two diagrams and one image.
Multi-wavelength Spectrum Diagram
The first diagram, a line graph titled “Spectrum,” is on the left. The y-axis is labeled “Relative brightness,” which increases upward, and the x-axis is labeled “Wavelength,” which increases to the right. A white jagged line depicts the spectrum. A tall and narrow triangular tab connects to a black box toward the top, which shows a zoomed in perspective of the graph’s leftmost area and a decreasing white line. The spectral line on the main graph starts low and increases sharply, forming a soft hill before decreasing. The line hits its lowest point about halfway along the x-axis, before increasing sharply, and forming peaks and valleys. The line generally increases before gradually and smoothly decreasing about a third of the way along the x-axis.
Multi-wavelength Image
On the right of the “Spectrum” diagram is an area labeled “Image,” which shows the galaxy. A bright, elliptical white core is in the center. A thin blue-green disk is in the center, while purple, red, and blue fluffy material form a roughly hourglass shape above and below. The galaxy lies against a dark background with many small, blue dots scattered across.
Multi-wavelength Spectrum Bar
Below “Spectrum” and “Image” is a rainbow-colored bar. From left to right, the bar gradually changes in color and labels indicate which color corresponds to which wavelength of light: X-ray (purple), Visible (blue, green, and yellow), Mid-Infrared (orange), and Far-Infrared (red). A thin white line in-between the text and bar runs across its entirety with arrows pointing at all four wavelengths of light.
Labels: Multi-wavelength
There are three text labels. Toward the left, an increasing, narrow-jagged line is labeled “Light from stars and gas.” A smooth decreasing line toward the ultimate right of the graph is labeled “Light from dust.” The image is labeled “Stars, gas, and dust.”
Caption: Multi-wavelength
The spectrum of light emitted by galaxy M82 reveals a variety of materials with different temperatures.
Stop 2: X-ray
Image Description: X-ray
The same layout is presented here.
X-ray Spectrum Diagram
The spectrum diagram on the left shows a white jagged line that generally trends upward, with some distinct peaks about halfway along the x-axis. Toward the end, the line gently slopes downward. The line is made of a series of points shown as white crosses. The size of the cross indicates the uncertainty in the measurement. The crosses are largest toward the bottom left corner of the diagram, and smallest toward the upper right area.
X-ray Image
On the right of the “Spectrum” diagram is an area labeled “Image,” which shows the galaxy. A bright fuzzy center is closely surrounded by the wispy purple disk of the galaxy. Above and below the disk are blue plumes of smoke-like material. The galaxy lies against a dark background with many small, blue dots scattered across.
X-ray Spectrum Bar
Below “Spectrum” and “Image” is a rainbow-colored bar that has different wavelengths of light labeled across it. A thin white line in-between the text and bar runs across the X-ray section on the far left with an arrow pointing to the word “X-ray,” indicating that this is X-ray light.
Labels: X-ray
There are three text labels. A point toward the bottom left of the graph is labeled “Light from iron.” A triangular peak about halfway along the x-axis is labeled “Light from sulfur.” The center of the galaxy’s image is labeled “Hot gas.”
Caption: X-ray
The X-ray spectrum shows hot gas with atoms whose electrons have been stripped off by powerful supernova explosions.
Stop 3: Visible
Image Description: Visible
The same layout is presented here.
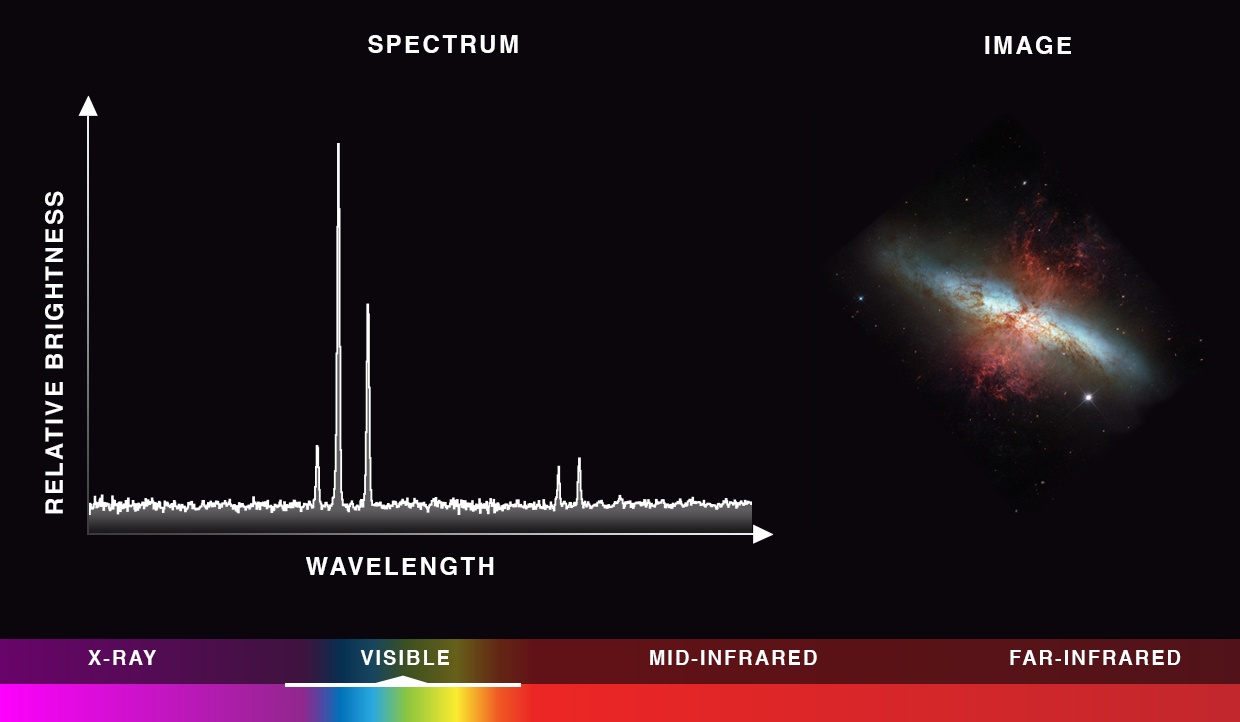
Visible Spectrum Diagram
The spectrum diagram on the left shows a white jagged line that is generally flat, but has five very narrow peaks. Three peaks are clustered near the middle and two are clustered to the right. The second of the peaks is the tallest, while the third is half its height. The other three are all about a fifth of the tallest peak’s height.
Visible Image
On the right of the “Spectrum” diagram is an area labeled “Image,” which shows the galaxy. The disk of the galaxy is seen as a glowing blue-white thin area. Above and below the disk is an hourglass-shaped area of brown thread-like material that resembles paint splatters. This feature is roughly half the size as the hourglass-shaped area seen in the X-ray image. Further away, blue plumes of smoke-like material surround the bright center. The galaxy lies against a dark background with some white dots scattered across.
Visible Spectrum Bar
Below “Spectrum” and “Image” is a rainbow-colored bar that has different wavelengths of light labeled across it. A thin white line in-between the text and bar runs across the visible section, with an arrow pointing to the word “visible,” indicating this is visible light.
Labels: Visible
There are three text labels. The tallest peak on the spectrum graph is labeled “Light from hydrogen,” while the second tallest peak is labeled “Light from nitrogen.” The brown thread-like material in the image is labeled “Warm gas.”
Caption: Visible
The visible spectrum shows elements in warm gas heated by young stars and thrown out from the central starburst region.
Stop 4: Mid-infrared
Image Description: Mid-infrared
The same layout is presented here.
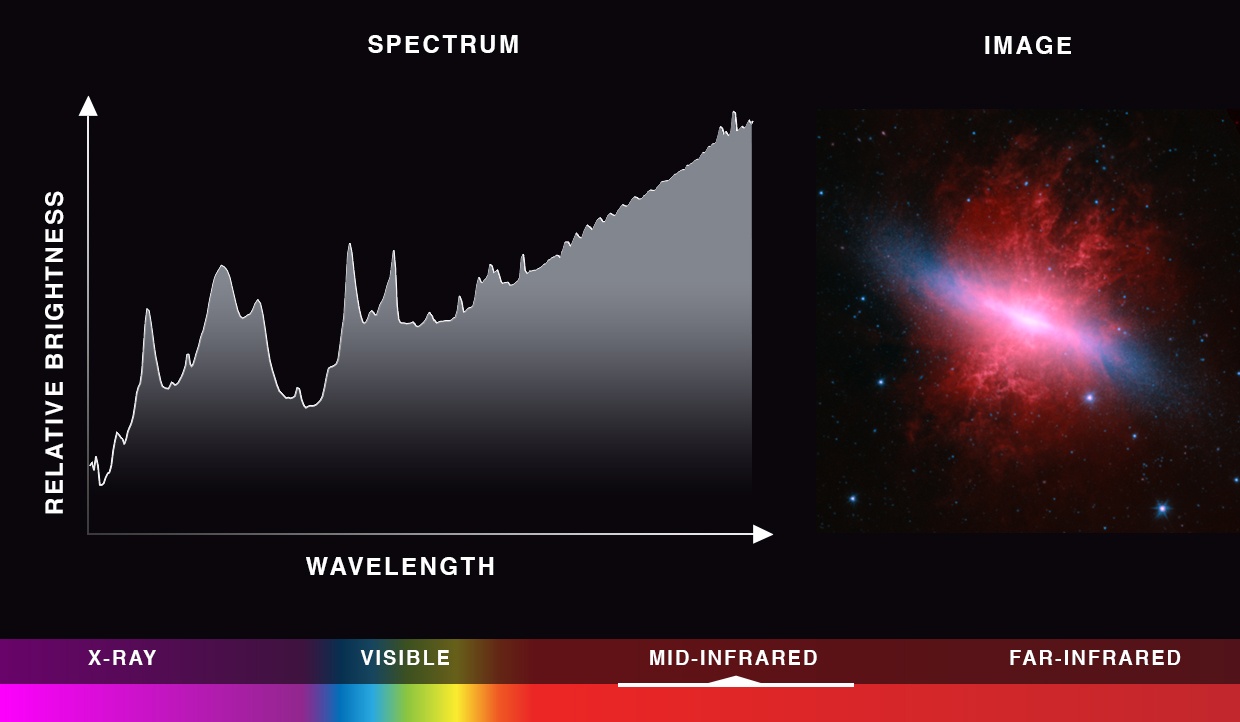
Mid-infrared Spectrum Diagram
The spectrum diagram on the left shows a smooth line with many peaks and valleys toward the beginning. About halfway along the x-axis, the line becomes less varied and trends gradually upward.
Mid-infrared Image
On the right of the “Spectrum” diagram is an area labeled “Image,” which shows the galaxy. The disk of the galaxy is seen as a thin area of glowing white material in the center. Fluffy red strands emanate from above and below the disk, roughly twice the size than in the visible image. The galaxy lies against a dark background with many small, blue dots, which are stars—some with diffraction spikes—scattered across.
Mid-infrared Spectrum Bar
Below “Spectrum” and “Image” is a rainbow-colored bar that has different wavelengths of light labeled across it. A thin white line in-between the text and bar runs across the mid-infrared section, with an arrow pointing to the word “mid-infrared,” indicating that this is mid-infrared light.
Labels: Mid-infrared
There are three text labels. One of the peaks on the spectrum graph is labeled “Light emitted by hydrocarbons.” A nearby valley is labeled “Light absorbed by silicate dust.” The fluffy red material in the image is labeled “Warm hydrocarbons.”
Caption: Mid-infrared
The mid-infrared spectrum shows that the warm dust carried away from the central region is rich with hydrocarbons and silicates.
Stop 5: Far-infrared
Image Description: Far-infrared
The same layout is presented here.
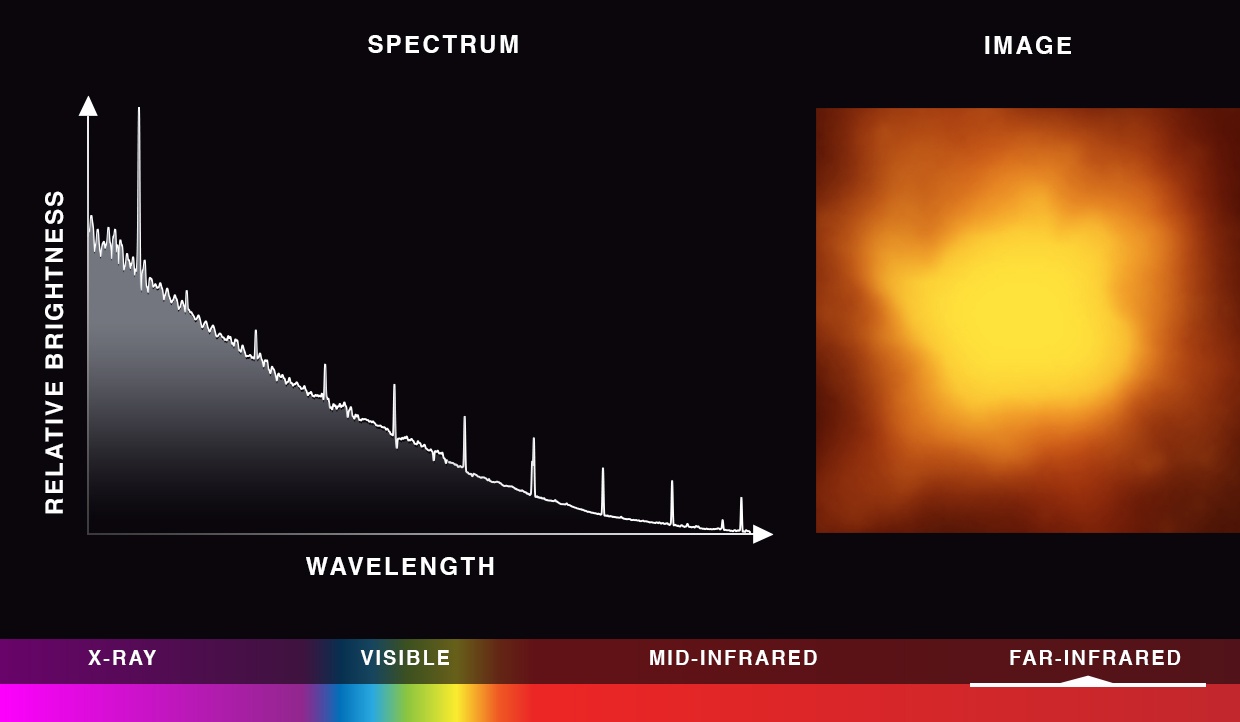
Far-infrared Spectrum Diagram
The spectrum diagram on the left shows a white jagged line that is generally decreasing. There are several distinctive and thin peaks, which grow in frequency further to the right along the x-axis.
Far-infrared Image
On the right of the “Spectrum” diagram is an area labeled “Image,” which shows the galaxy. A bright yellow, hazy asymmetrical blob is in the center, which broadly outlines the shape of the galaxy and is much larger in size than in prior stops. The bright yellow blob is surrounded by hazy orange material.
Far-infrared Spectrum Bar
Below “Spectrum” and “Image” is a rainbow-colored bar that has different wavelengths of light labeled across it. A thin white line in-between the text and bar runs across the far-infrared section on the far right, with an arrow pointing to the word “far-infrared,” indicating that this is far-infrared light.
Labels: Far-infrared
There are three text labels. The first distinct peak along the spectrum graph is labeled “Light from nitrogen.” One of the smaller peaks along the graph about halfway across is labeled “Light from carbon monoxide.” The glowing yellow blob in the center of the image is labeled “Cold dust and gas.”
Caption: Far-infrared
The far-infrared spectrum shows nitrogen and carbon monoxide in the cold gas and dust throughout the galaxy.