Interactive Overview
Slider Interactive: A series of graphs depicting the spectrum of Supernova E0102. Below the caption is a horizontal slider bar with six labeled stops and a solid white circle. Dragging the white circle right and left along the slider bar causes the image, labels, and caption to change. The change occurs gradually as one image, along with its associated captions and labels, fades out and the next fades in. A toggle button to the upper right of the image turns the image labels off and on. Labels are in the form of text with arrows pointing to specific features in the image. Other labels are graphic overlays.
Slider Stops
From left to right, the slider stops are labeled: 2 hours, 5 hours, 10 hours, 25 hours, 50 hours, and 77 hours.
Summary of Slider Stops
Sliding left to right reveals the following:
- “2 hours” stop shows a graph of Supernova E0102’s spectrum and an image of the supernova in the top right corner. This is the initial image shown when the interactive is loaded.
- “5 hours” stop shows the same graph of the supernova’s spectrum, with the spectral line growing taller and the supernova image becoming slightly brighter.
- “10 hours” stop shows the same graph of the spectrum, with the spectral line growing even taller and the supernova image becoming brighter than before.
- “25 hours” stop shows the same graph of the spectrum, with the spectral line growing even taller and smoother, and the supernova image growing in brightness and becoming less fuzzy.
- “50 hours” stop shows the same graph of the spectrum, with the spectral line growing in height and becoming smoother in shape—broadly resembling a bell curve—with more defined peaks. The image of the supernova is brighter than before.
- “77 hours” stop shows the same graph of the spectrum, with the spectral line growing taller and the image of the supernova becoming brighter.
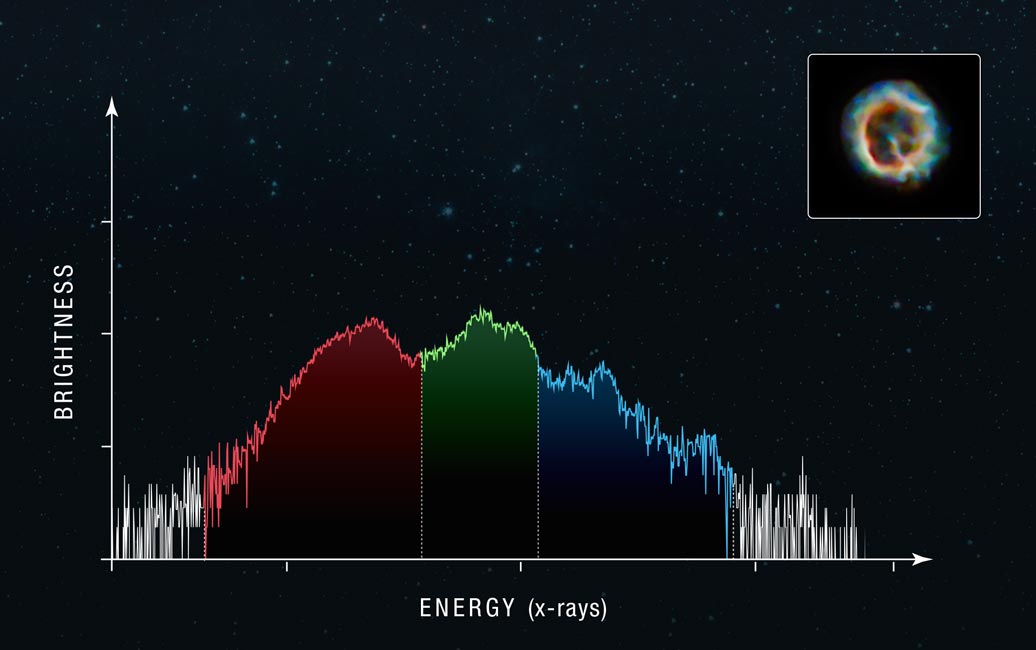
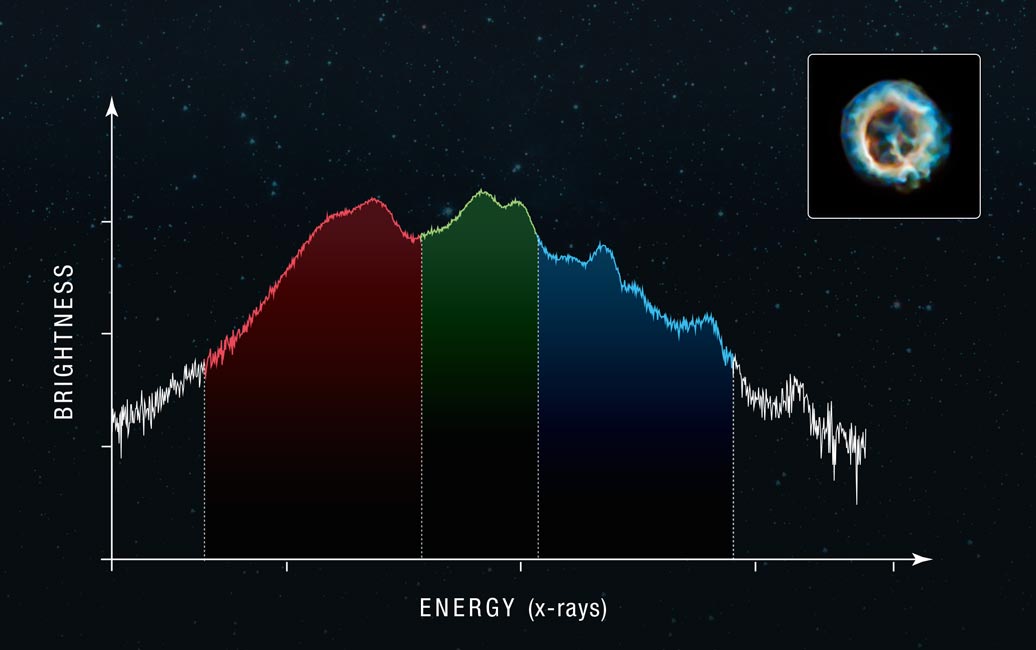
Stop 1: 2 hours
Image Description: 2 hours
Against a black swath of space with stars scattered, a line graph takes up the majority of the image. The y-axis is labeled “Brightness” and the x-axis is labeled “Energy (X-rays).” Four evenly spaced notches run across the y-axis, while five notches run along the x-axis. Areas of the graph are shaded in different colors, from left to right: red, green, and blue. The areas outside of the colored areas—the leftmost and rightmost sections—are white. The line begins as white in color and very jagged in shape, starting low at the left and gradually rising to form three distinct peaks: The first is in the red area. The second is in the green area and is at a similar height to the first. The third is in the blue area and is slightly lower and more difficult to discern. The two highest peaks are just above the third notch on the y-axis. After the third peak, the line decreases, becomes more jagged, and is white in color again. In the top right corner, an image of the supernova is in a black box. The object resembles the letter Q: A ring with a line at the 5 o’clock position. The supernova is composed of colorful, hazy material: red, yellow, green, and blue.
Labels: 2 hours
There are three text labels and one graphic overlay. A yellow oval encompasses the red and green peaks on the graph, which is labeled “Oxygen and neon detected.” A portion of the shallow, narrow jagged lines that form the red and green peaks is labeled “Signs a massive star exploded.” The tall, narrow white spikes toward the right are labeled “Noisy, unclear data.”
Caption: 2 hours
To trace the movement of the million-degree gas ejected by a nearby supernova (pictured top-right), telescopes need to spend many hours observing.
Stop 2: 5 hours
Image Description: 5 hours
The same layout shows data after five hours of observation. The same areas of the graph are shaded red, green, and blue. The spectral line has grown in height, with the highest peaks halfway between the third and fourth notches on the y-axis. Each peak is more distinct and slightly smoother in overall shape. The third peak in blue is easier to discern and a fourth peak starts to emerge further to the right in the blue area. In the top right corner, the image of the supernova appears slightly clearer.
Labels: 5 hours
There are three text labels. The image of the supernova in the top right corner is labeled “Image becomes clearer.” A portion of the graph’s center is labeled “Data become clearer.” In the blue section of the graph, a portion toward the right is labeled “Vague silicon line.”
Caption: 5 hours
Astronomers took a series of X-ray images and spectra to determine what the supernova remnant is made of and how the gas moves.
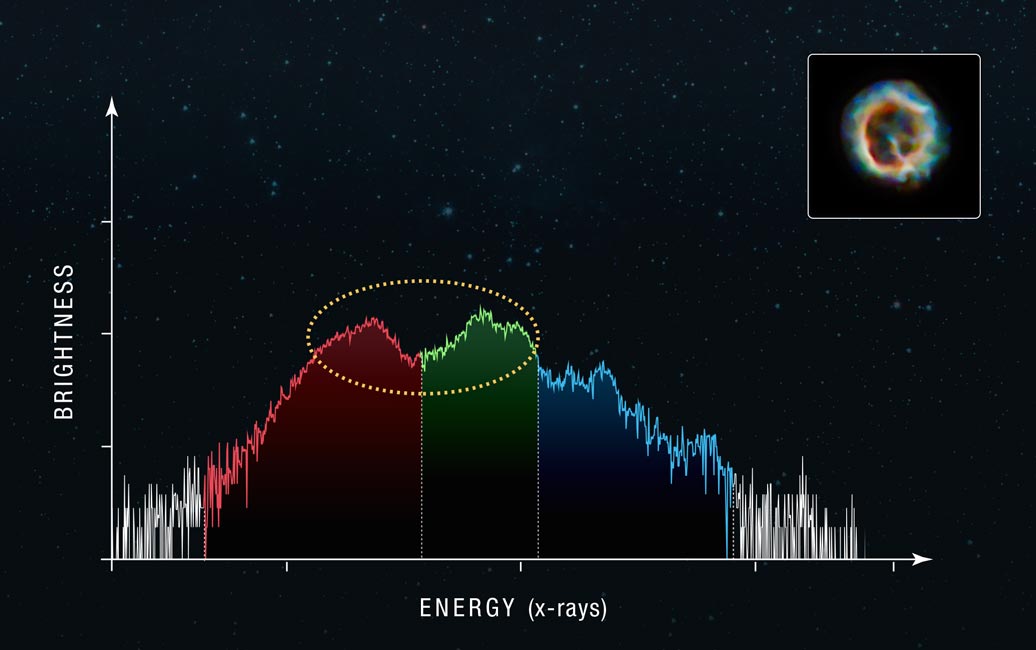
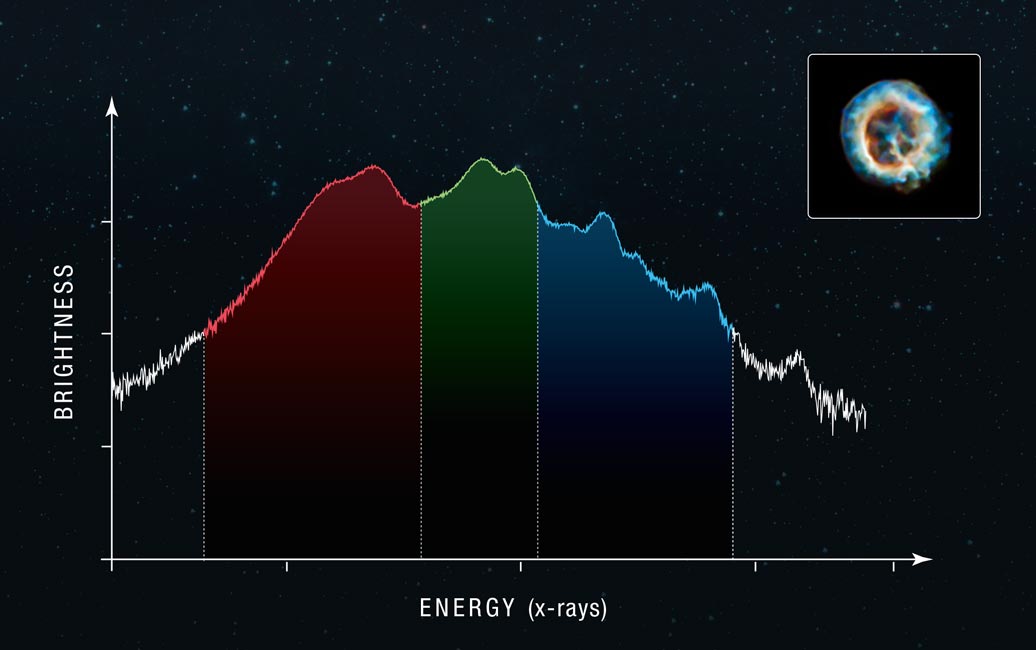
Stop 3: 10 hours
Image Description: 10 hours
The same layout shows data after 10 hours of observation. The same areas of the graph are shaded red, green, and blue. The spectral line has grown in height. The two highest peaks are just below the fourth notch on the y-axis. Each peak is more distinct and slightly smoother in overall shape. The spectral line itself has also become smoother. Two distinct bumps are starting to form in each of the red and green areas of the graph. In the top right corner, the image of the supernova appears slightly clearer and brighter.
Labels: 10 hours
There are two text labels. Among the red portion of the graph, an area is labeled “Distinct oxygen lines emerge.” The tall, narrow white spikes toward the right are labeled ““Noise” or an element?”
Caption: 10 hours
After 10 hours, it is hard to determine if other parts of the spectra are signal or random noise.
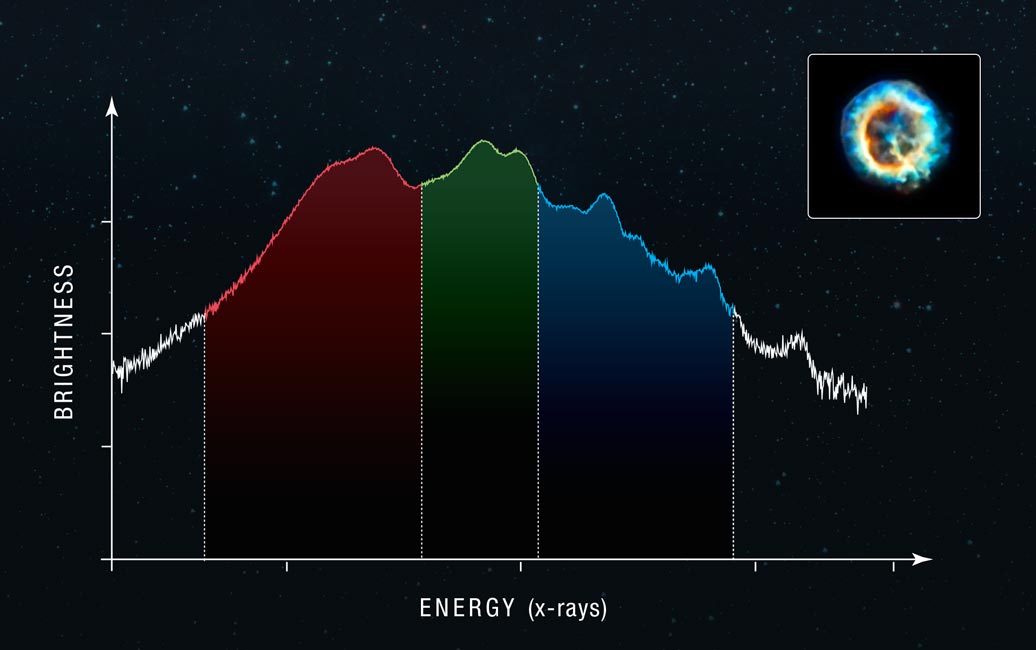
Stop 4: 25 hours
Image Description: 25 hours
The same layout shows data after 25 hours of observation. The same areas of the graph are shaded red, green, and blue. The spectral line has grown in height and is becoming smoother in overall shape. The spectral line itself has also become smoother. The two highest peaks are above the fourth notch on the y-axis. The fourth peak, which is located within the blue area, is more discernable than before. A noticeable fifth peak begins to emerge in the white section toward the right. Each peak is more distinct and slightly smoother in overall shape. In the top right corner, the image of the supernova appears slightly clearer, with new fuzzy wisps appearing.
Labels: 25 hours
There are two text labels. Within the red portion of the graph, the left bump near the top of the peak is labeled “Lower-energy oxygen.” Toward the right, the top of the peak in the red area is labeled “Higher-energy oxygen.”
Caption: 25 hours
After 25 hours, two signatures of oxygen are clearly detected in the gas blasted out by the exploding star.
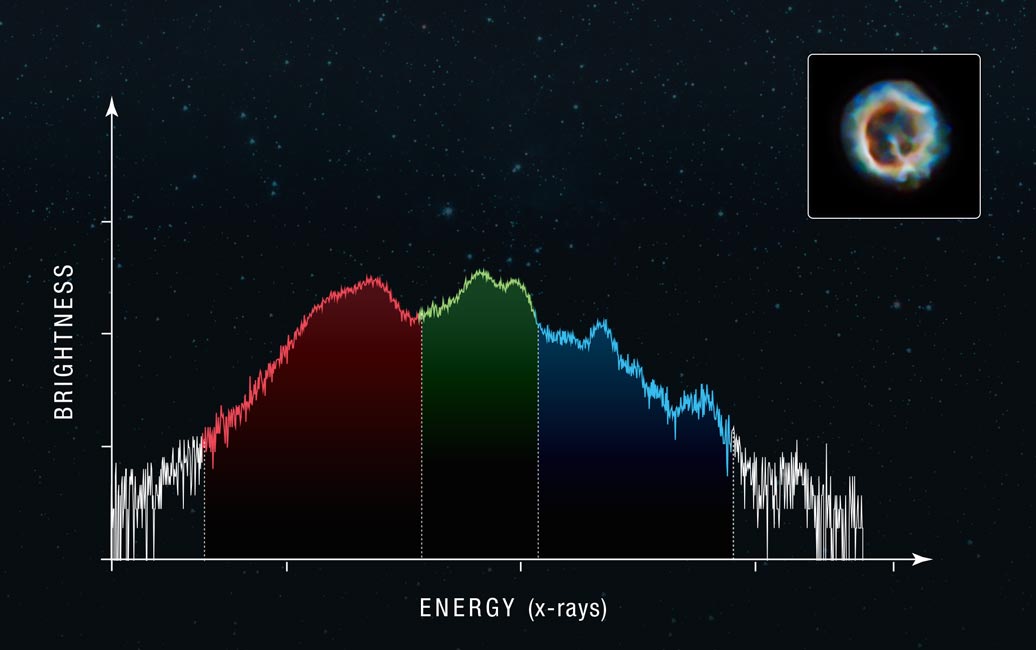
Stop 5: 50 hours
Image Description: 50 hours
The same layout shows data after 50 hours of observation. The same areas of the graph are shaded red, green, and blue. The spectral line has grown in height and is becoming smoother in overall shape. The spectral line itself has also become smoother. The two highest peaks are well above the fourth notch on the y-axis. Each peak is more distinct and slightly smoother in overall shape. In the top right corner, the image of the supernova appears slightly clearer and brighter.
Labels: 50 hours
There are three text labels. In the middle of the graph, among the green portion, is a label that reads “Neon.” A small peak near the right end of the blue section is labeled “Silicon.” A small, jagged peak toward the very right that began to emerge in the “25 hours” stop is labeled “Sulfur.”
Caption: 50 hours
More elements—and how fast they are traveling—become clearer with longer observations.
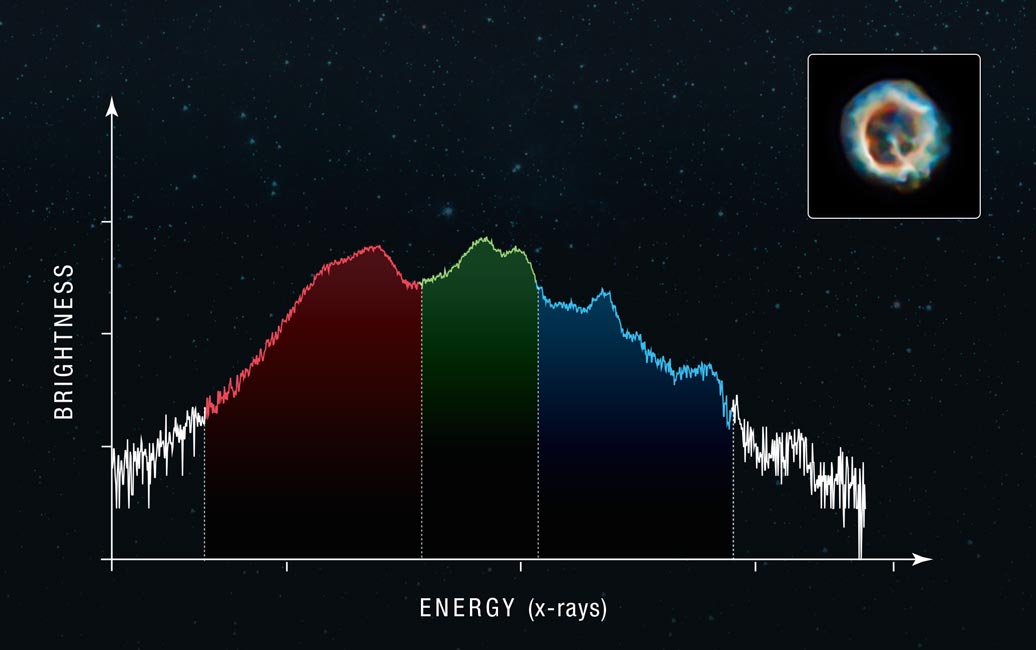
Stop 6: 77 hours
Image Description: 77 hours
The same layout shows data after 77 hours of observation. The same areas of the graph are shaded red, green, and blue. The spectral line has grown in height, with peaks in the red, green, and blue areas extending almost to the end of the y-axis. Each peak is more distinct and slightly smoother in overall shape. The spectral line itself has also become smoother. In the top right corner, the image of the supernova appears slightly brighter.
Labels: 77 hours
There are two text labels. The image of the supernova in the top right corner is labeled “Brighter image indicates clearer data.” A peak in the middle of the spectral line is labeled “Higher lines indicate clearer data.”
Caption: 77 hours
Repeated observations built a precise data set that identifies the exploded star’s chemicals and measures how fast the gas moves.