Interactive Overview
Slider Interactive: A series of labeled images with captions. Below the caption is a horizontal slider bar with six labeled stops and a solid white circle. Dragging the white circle right and left along the slider bar causes the image, labels, and caption to change. The change occurs gradually as one image, along with its associated caption and labels, fades out and the next fades in. A toggle button to the upper right of the image turns the image labels off and on. Some labels are in the form of text with arrows pointing to specific features in the image. Other labels are graphic overlays.
Slider Stops
From left to right, the slider stops are labeled: Naked-Eye View, Telescope View, Spectrograph, Spectrum, Graph, and Interpretation. The first image to display shows the Naked-Eye View.
Summary of Slider Stops
Sliding left to right reveals the following:
- “Naked-Eye View” stop shows a portion of the night sky with the star Altair labeled.
- “Telescope View” stop shows a zoom-in of Altair and background stars.
- “Spectrograph” stop shows light from Altair spreading out to form a rainbow.
- “Spectrum” stop shows details in the rainbow of light from Altair.
- “Graph” stop shows both the picture of the rainbow and a graph version of the rainbow.
- “Interpretation” stop includes explanation of some features on the graph.
Stop 1: Naked-Eye View
Image Description: Naked-Eye View
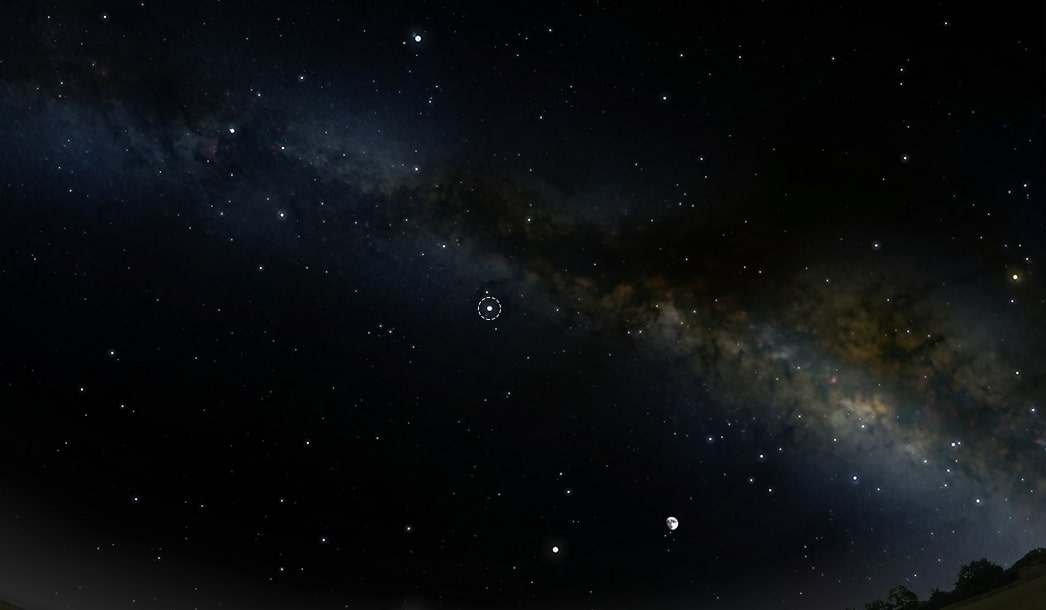
Photograph of a section of the dark night sky with the relatively bright swath of the Milky Way forming an arc from the top left to bottom right, where it disappears behind the silhouette of a tree-lined hill. The upper left portion of the Milky Way consists of dim white cloud-like light with some pinkish spots. The lower right half is brighter and yellower, also with a few pinkish areas. Dark shadowy smoke-like material runs through both portions. Within, above, and below the Milky Way is a scattering of stars that look like small points of light. The three-quarter Moon is also visible. One star in the middle, just below the main band of the Milky Way, is circled with a dashed line.
Labels: Naked-Eye View
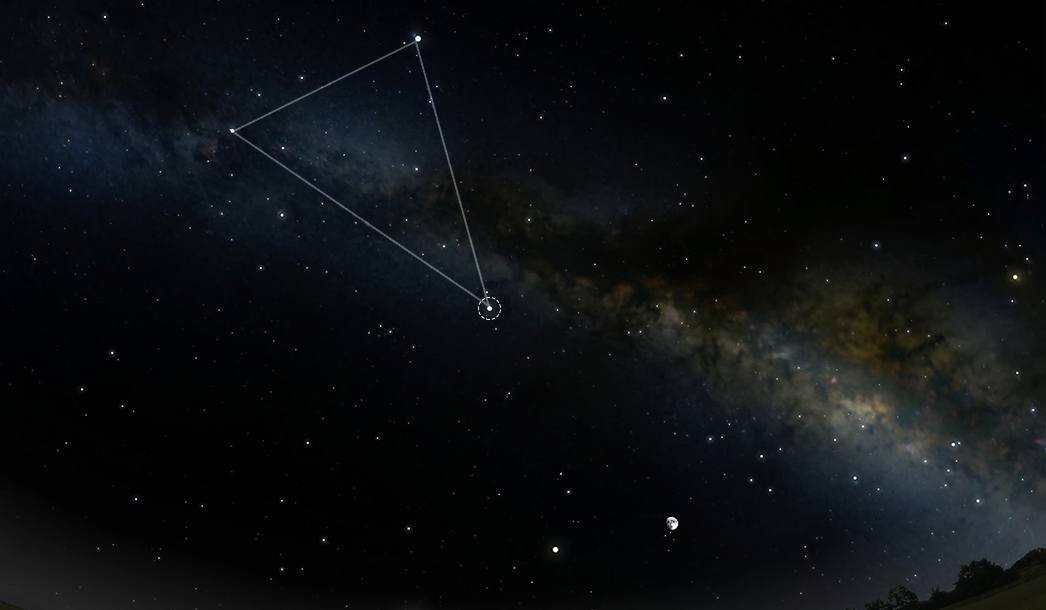
There are three text labels and one graphic overlay. The bright swath of light running from top left to bottom right is labeled, “Milky Way.” Three white lines connect three stars in the upper left portion of the Milky Way to form a triangle, which is labeled “Summer Triangle.” The bottom vertex of the triangle is the circled star, which is labeled “Altair.”
Caption: Naked-Eye View
Altair is a bright star visible in the summer night sky in the northern hemisphere.
Stop 2: Telescope View
Image Description: Telescope View
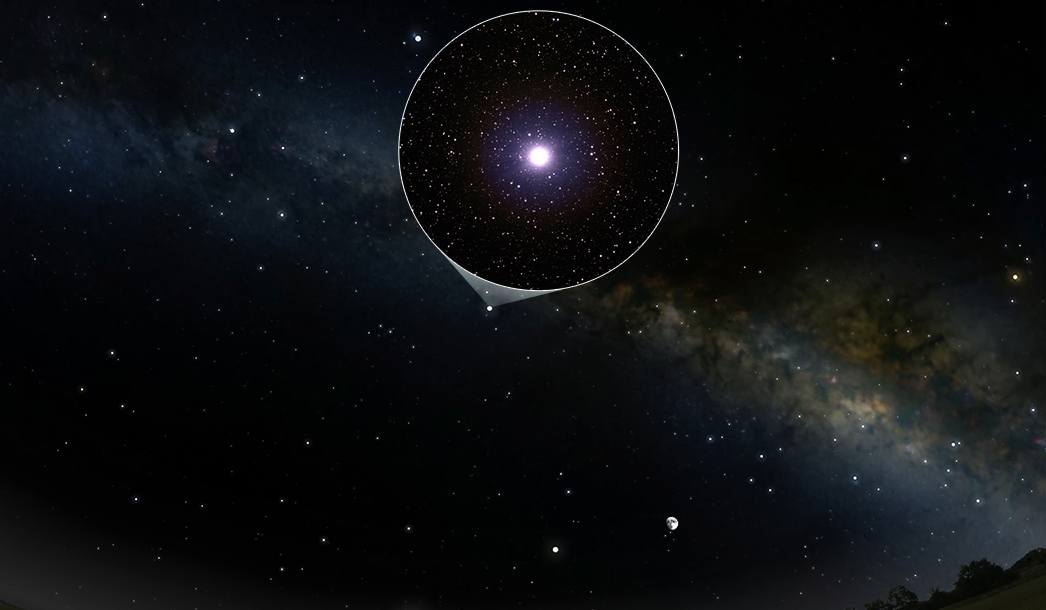
This is the same as the photograph in the “Naked-Eye View” stop, but with different overlays. The photograph shows a section of the dark night sky with the relatively bright swath of the Milky Way forming an arc from the top left to bottom right, where it disappears behind the silhouette of a tree-lined hill. Overlain on the photo, in the middle of the Milky Way, is a large circle with a magnified view of the star that is circled in the “Naked-Eye View” stop. The star looks like a bright solid white circle with a purplish glow. It is surrounded by many much-smaller points of light.
Labels: Telescope View
There are three text labels. The circle is labeled “Telescope view.” The large star in the middle of the telescope view is labeled “Altair.” The smaller points of light within the telescope view are labeled “More-distant stars.”
Caption: Telescope View
A backyard telescope shows Altair, a relatively close star with a blueish-white color.
Stop 3: Spectrograph
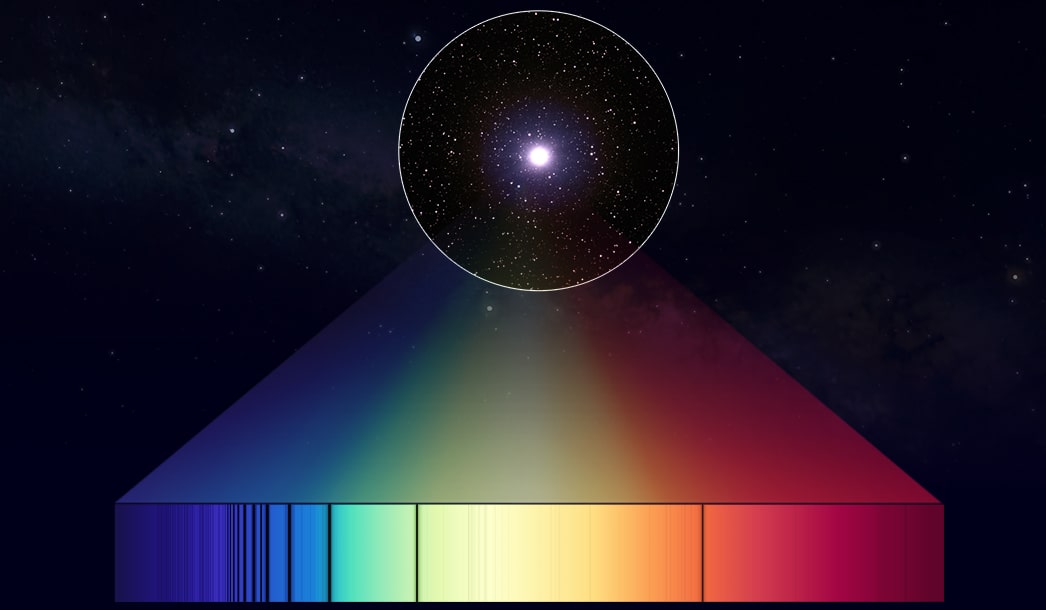
Image Description: Spectrograph
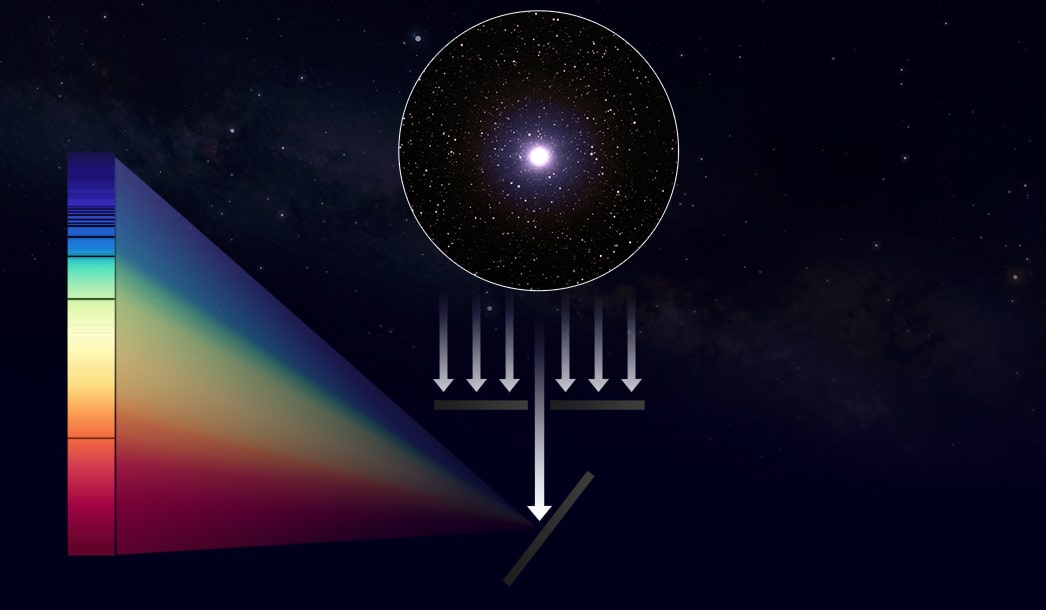
There are three main portions of the image: (1) A telescope image of a star; (2) A set of white arrows and gray bars; (3) A rainbow pattern, in two parts.
(1) In the top center of the image is the circular telescope view with the star Altair at the center. This is the same image shown in the “Telescope View” stop.
(2) Pointing straight down from the bottom edge of the center of the telescope view are seven white arrows. Six of the arrows end at two horizontal gray bars as though blocked by it. The center arrow, which is aligned with Altair passes between two horizontal gray bars, continuing until it hits a diagonal gray bar, which is oriented 45 degrees clockwise from vertical.
(3) Projecting out toward the left from the intersection of the white arrow and the diagonal gray bar is a rainbow, with red at the bottom and purple at the top. The rainbow spread outs vertically from right to left, forming a triangle. The left edge of the triangle is vertical.
Just to the left of the vertical edge of the rainbow is a vertical bar with a rainbow coloring, from red at the bottom to orange, then yellow, green, blue, and purple at the top. The rainbow is not perfectly continuous. Instead, there are a number of horizontal black lines, or gaps, between colors. Some of the black lines are thick and sharp and some are thin or very subtle.
The photograph of the Milky Way, which was prominent in the “Naked-Eyed View” and “Telescope View” stops, is now very dim and in the background.
Labels: Spectrograph
There are three labels. The long white arrow pointing straight down from the star to the diagonal gray bar is labeled, “Light from Altair.” The diagonal gray bar that the light from Altair arrow strikes is labeled, “Spectrograph.” The vertical rainbow with the black horizontal lines is labeled, “Spectrum of Altair.”
Caption: Spectrograph
A tool called a spectrograph, which is attached to the telescope, spreads Altair’s light out into a spectrum.
Stop 4: Spectrum
Image Description: Spectrum
In the top center of the image is the circular telescope view with the star Altair at the center.
Projecting out from the bottom of the circle is a rainbow with purple at the left and red at the right. The rainbow spreads out downward to form a triangle. The base of the triangle is horizontal.
Below this is a horizontal bar with a rainbow coloring, from purple at the far left to blue, then green, yellow, orange, and red at the far right. The rainbow is not perfectly continuous. Instead, there are a number of vertical black lines, or gaps, between colors. Some of the black lines are thick and sharp and some are thin or very subtle.
This horizontal rainbow with black lines is exactly the same as the vertical rainbow with black lines labeled “Spectrum of Altair” in the “Spectrograph” stop.
The photograph of the Milky Way is barely visible in the background.
Labels: Spectrum
There are two labels on the horizontal rainbow bar (the spectrum of Altair). A thin bright blue area between two vertical black bars on the left side of the spectrum is labeled, “Very bright color.” One of the distinct vertical black lines in the orange area on the right side of the spectrum is labeled, “Very dim color.”
Caption: Spectrum
Altair’s spectrum shows that its blueish-white light is actually a mixture of colors of different brightness.
Stop 5: Graph
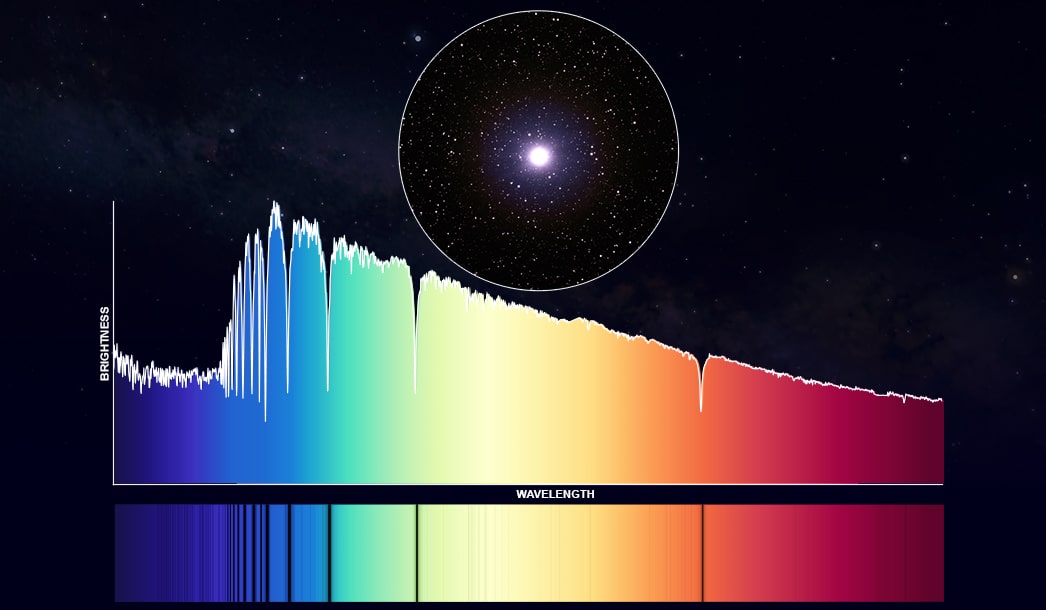
Image Description: Graph
In the top center of the image is the circular telescope view with the star Altair at the center.
Along the bottom of the image is the horizontal bar with a rainbow coloring and vertical black lines that was shown in the “Spectrum” stop and was labeled, “Spectrum of Altair” in the “Spectrograph” stop.
Above the horizontal rainbow bar is a line graph. The area below the graphed line has the same rainbow coloring as the horizontal bar, with purple at the left to red at the right. The colors in the graph are perfectly aligned with the horizontal rainbow bar (the spectrum of Altair) below.
The graph is labeled “Brightness” on the vertical y-axis and “Wavelength” on the horizontal x-axis. The graphed line is wavy and jagged, showing that the brightness changes with wavelength. The overall shape of the graphed line is relatively flat (level brightness) from purple to blue. It then jumps fairly suddenly, showing a sharp increase in brightness in the middle of the blue colors. It then decreases gradually from green to yellow to orange to red.
The overall trends are punctuated with steep valleys indicating wavelengths with very low brightness. The valleys correspond to the black vertical lines in the horizontal rainbow below the graph. The peaks on the graph correspond to colored areas between the black lines.
The photograph of the Milky Way is barely visible in the background.
Labels: Graph
There are two labels on the rainbow-patterned graph. A tall peak in the bright blue area between two steep valleys on the left side of the graph is labeled, “Very bright color.” This peak aligns with the thin bright blue area of the horizontal bar that is labeled “Very bright color” in the “Spectrum” stop.
One of the deep valleys in the orange area on the right side of the graph is labeled, “Very dim color.” The valley aligns with the vertical black line in the orange area of the horizontal bar that is labeled “Very dim color” in the “Spectrum” stop.
Caption: Graph
A graph of the spectrum shows exactly how bright each color is.
Stop 6: Interpretation
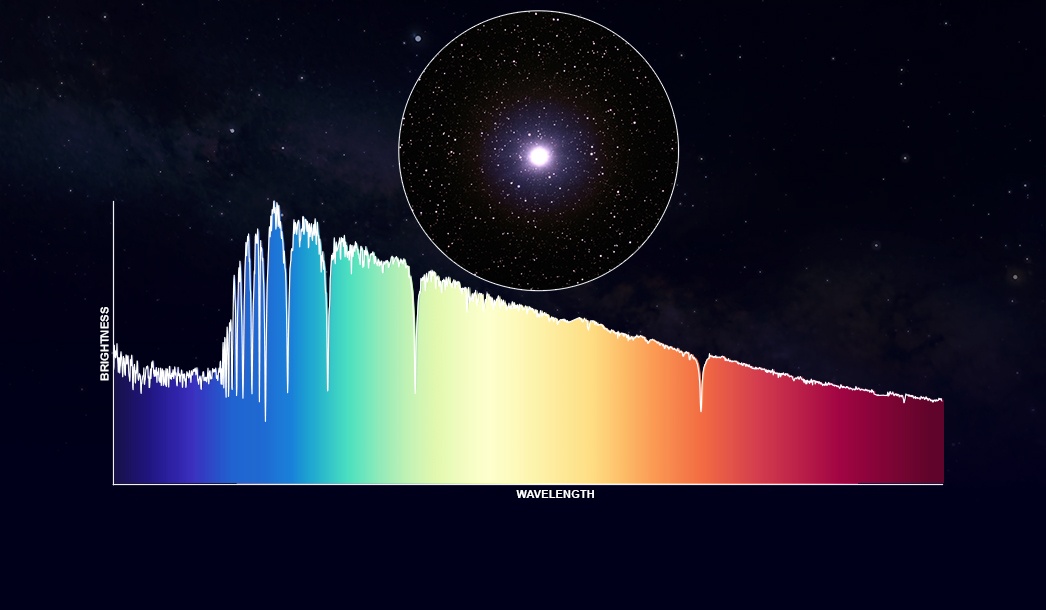
Image Description: Interpretation
In the top center of the image is the telescope view with the star Altair at the center.
Below the telescope view is the same rainbow-shaded line graph that was shown in the “Graph” stop.
The graph is labeled “Brightness” on the vertical y-axis and “Wavelength” on the horizontal x-axis. The graphed line is wavy and jagged, showing that the brightness changes with wavelength. There are distinct peaks showing colors that are relatively bright and valleys indicating colors that are much dimmer.
The photograph of the Milky Way is barely visible in the background.
Labels: Interpretation
There are three labels on the graph. A tall peak in the blue area on the left side of the graph is labeled “8,000 degrees C surface”. This is the same peak that was labeled, “Very bright color” in the “Graph” stop. An area in the green portion near the middle of the graph is labeled, “Rotating rapidly.” This part of the graph was not labeled in a previous stop. A valley in the orange area on the right side of the graph is labeled, “Mostly hydrogen.” This is the same valley that was labeled, “Very dim color” in the “Graph” stop.
Caption: Interpretation
The brightness pattern gives us information about Altair’s temperature, composition, and motion.